

Record your first evaluation
Your code runs the benchmark and grades the answers; Sovara records and displays the results. Start with the SDKs to connect your agent. The Python SDK reference describes how to create an evaluation run and log sample results. Each evaluation run groups one execution of your benchmark. Each sample is an individual agent run with its own input, output, verdict, and trace. Create a new evaluation run each time you execute the benchmark so you can compare results over time. Record your samples’ inputs and outputs, and supply a correctness verdict from your evaluator. You can also log custom fields on individual samples or on the whole evaluation run, such as the dataset version or an aggregate score.Open your evaluation results
Open your project and select Evaluations in the sidebar under Track performance.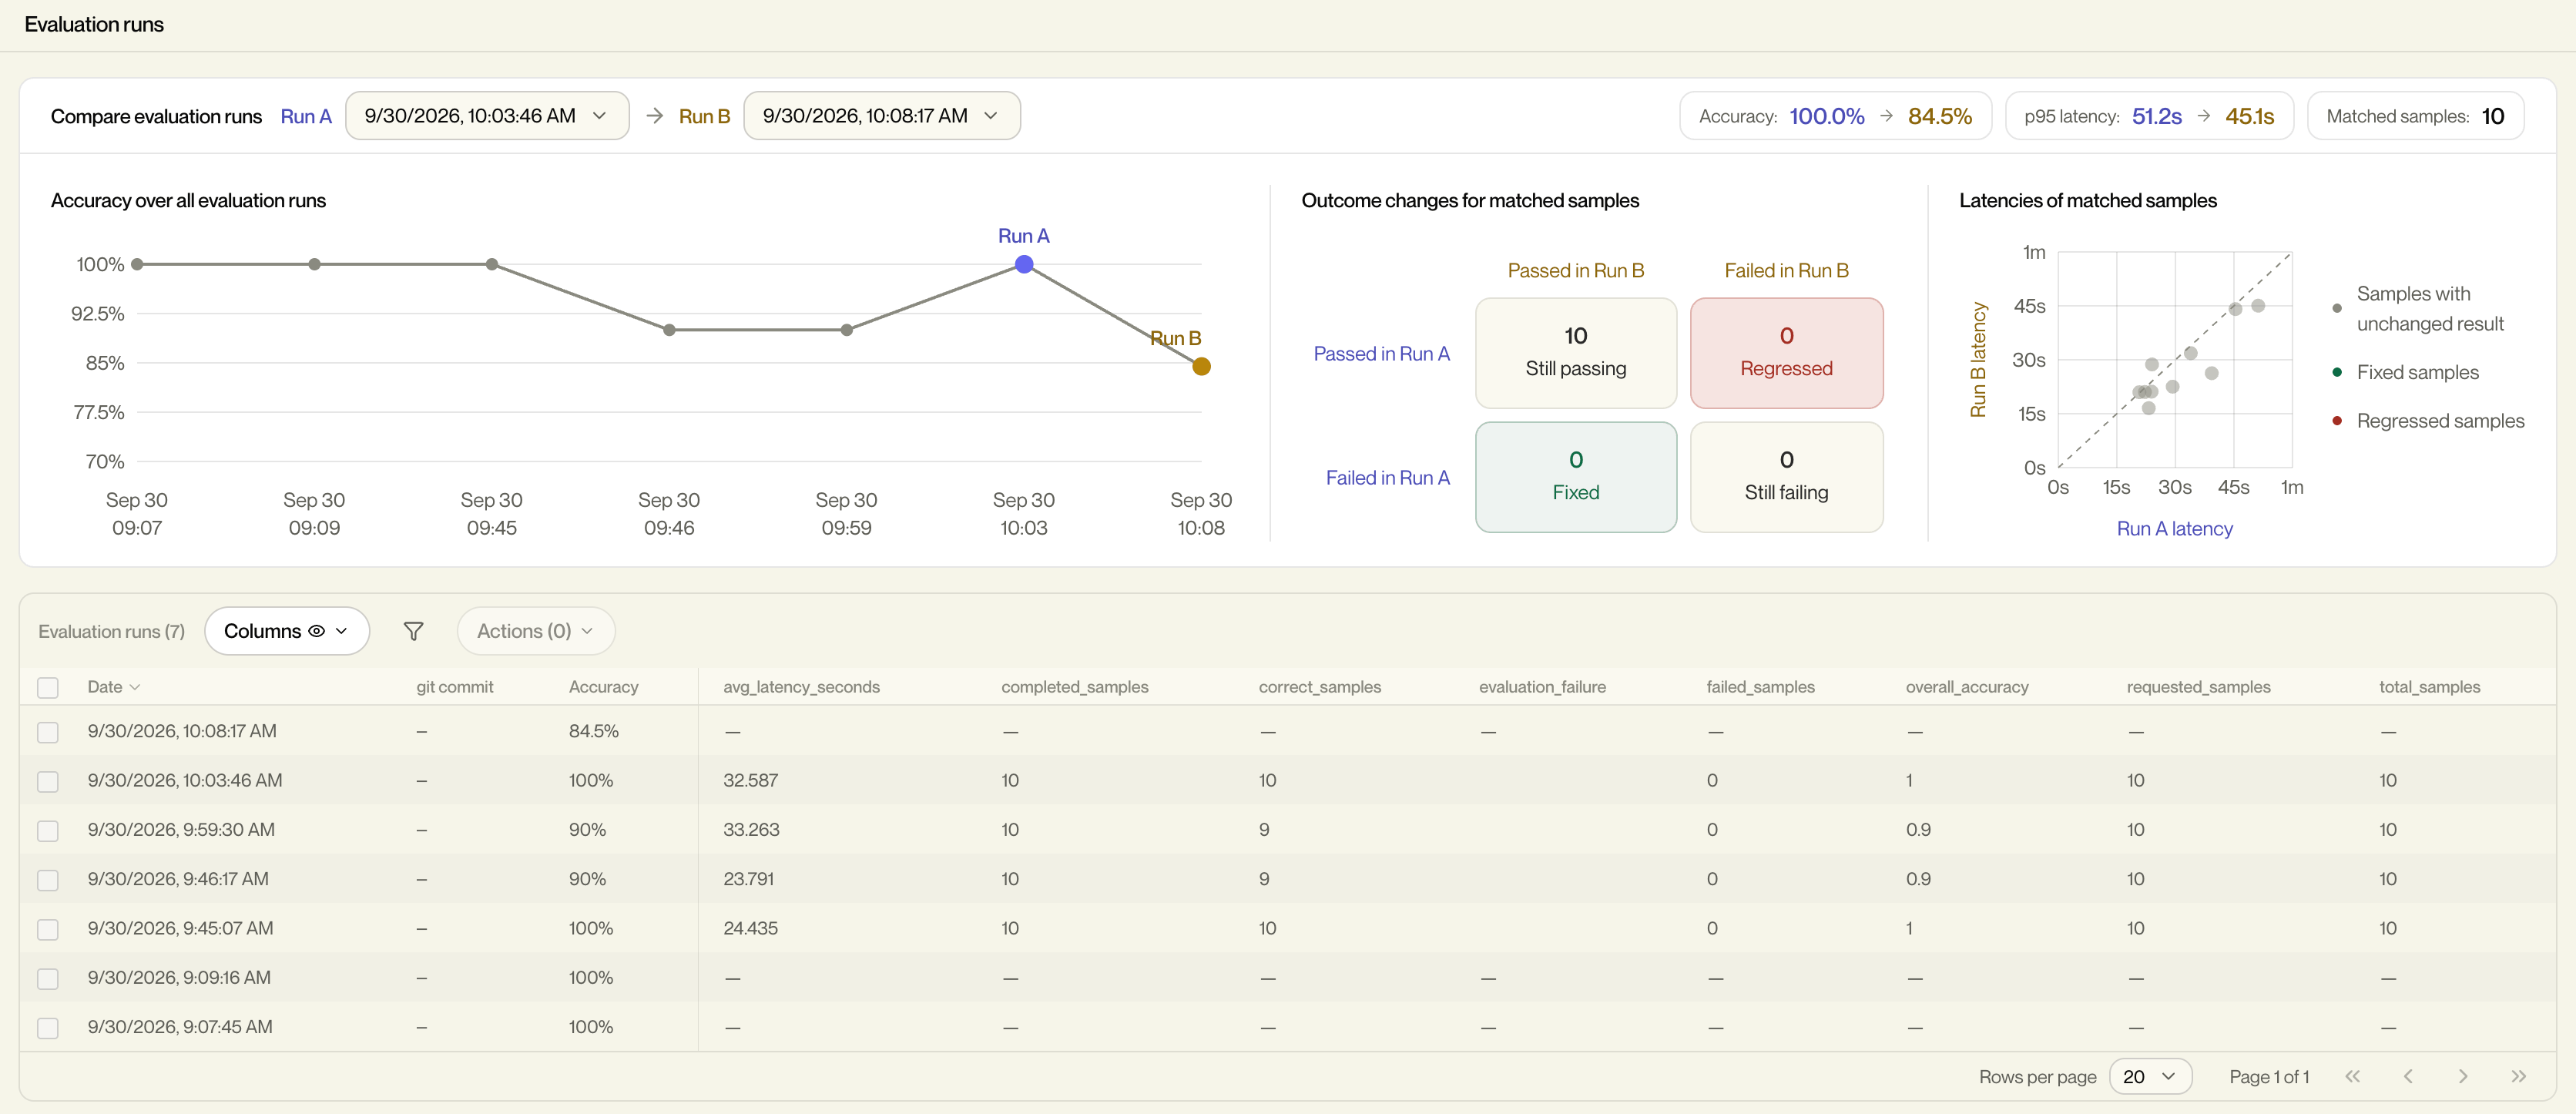
- Open Filters to search dates and logged fields, filter by git commit, or narrow the accuracy range.
- Use Columns to choose which fields appear. Click a column heading to sort the table.
- Click an evaluation row to open its samples.
Compare two evaluation runs
At the top of the page, choose your baseline in Run A and the evaluation you want to assess in Run B. Use evaluations of the same benchmark with the same grading criteria for a meaningful comparison. The summary shows accuracy for each evaluation, p95 latency, and the number of matched samples. The charts help you answer three questions.Has accuracy changed over time?
Accuracy over all evaluation runs shows the history of your project’s evaluations. Hover over a point to see its date, accuracy, and sample count. The selected Run A and Run B are highlighted. By default, accuracy is the share of graded samples marked correct; ungraded samples are excluded. A valid evaluation-levelaccuracy value logged through
the SDK overrides that calculation. This is why the summary accuracy can differ
from the outcomes of the matched samples shown beside it.
Which samples improved or regressed?
Outcome changes for matched samples separates the results into four groups:
Click a group to open those samples in Run B. Start with Regressed to
investigate new failures, then check Fixed to see where your change helped.
Samples match across evaluations by their exact recorded input text. Keep
benchmark inputs consistent between runs. Inputs that are missing or occur
more than once within either evaluation are excluded from matching. The four
outcome groups include only matches with correctness verdicts in both runs.